Capturing event metrics to track event KPIs can be a challenge.
Omnichannel strategies to create a personalized, engaging customer experience across various touchpoints are on the rise. And it’s becoming more difficult to consolidate data from different platforms that don’t communicate seamlessly with each other.
But collecting event success metrics to monitor your event management and event marketing KPIs is vital if you want to address customers’ pain points and elevate their experience.
With events one of the only remaining sources of first-party data, if you don’t have an omnichannel event tech stack in place to measure event metrics and monitor event KPIs:
- How will you understand how your customers engaged with every touchpoint across the omnichannel journey?
- How will you build better event engagement in the future to attract more attendees and reduce costs?
- How will you define your next best action with customers?
- How will you measure the success of your event and show the value events create for your business?
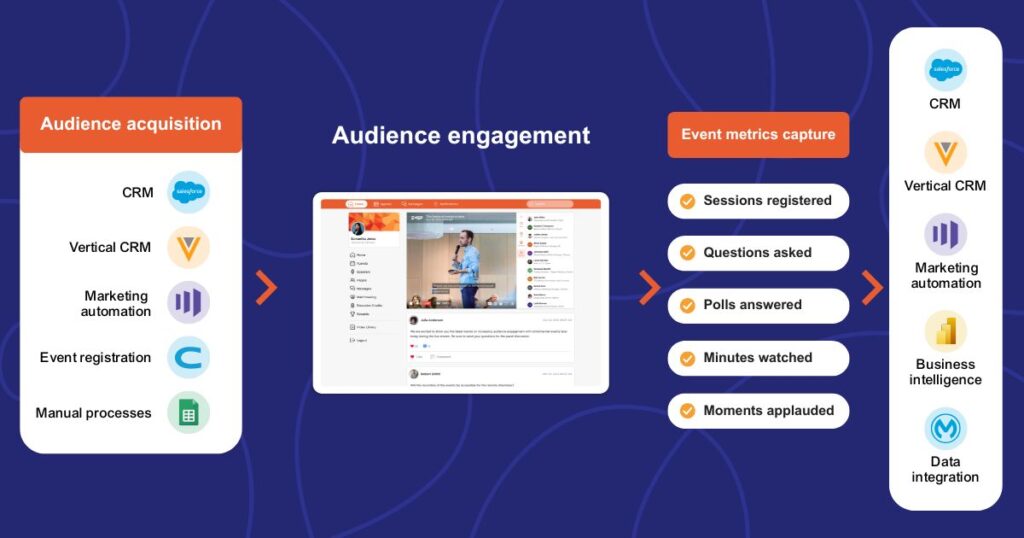
We’ve worked with hundreds of leading life science and professional services companies to create engaging, omnichannel event experiences with a powerful event tech stack that gathers deep data insights and feeds them automatically to your CRM to enrich records.
In this article, you’ll discover 19 event metrics you should be collecting with your integrated event platform to successfully track your event KPIs and improve your omnichannel event experience, whether your events are in-person, virtual, or hybrid.
Looking for an event metrics template with a complete list of event success metrics to help you easily set and monitor event KPIs? Download our event brief template now and go to the relevant worksheet.
Event metrics vs event KPIs
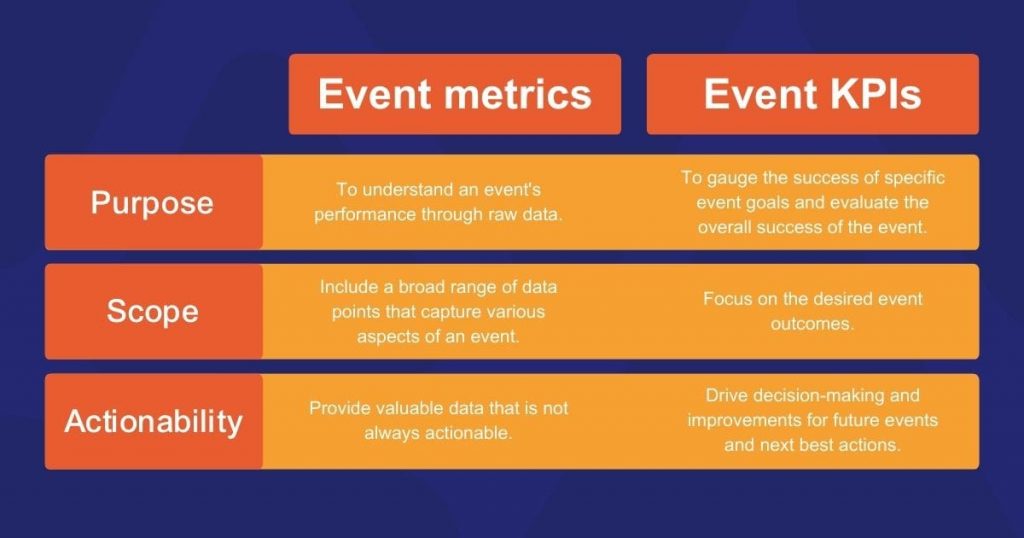
Understanding the effectiveness and impact of your virtual, in-person, or hybrid events is critical to ensuring their success. To evaluate and measure an event’s performance, we rely on data-driven insights, which come in the form of event metrics and event KPIs. While people often use these terms interchangeably, they are not the same.
Before delving into the event success metrics you should be capturing to track your event KPIs, it’s important to understand the difference between them.
What are event metrics?
Event metrics are quantitative measurements that capture various aspects of an event. From attendee engagement to financial performance. They provide a snapshot of an event by serving raw data about, for example:
- Number of attendees
- Number of meetings
- Clap count
- Live stream watch time
- Number of poll votes
Event marketers use event metrics to compare the performance of different events, determine marketing strategy and event ROI, and measure the success of event KPIs.
You can also use event metrics can to track the success of sponsorships, identify gaps in attendee conversion, and evaluate the success of event marketing campaigns. Event metrics can provide powerful insights into the success of events and help guide future decisions.
What are event KPIs?
Event KPIs track performance or progress based on your specific event goals. They are strategic indicators that communicate the progress of your event goals. Whereas, event metrics track the specific aspects that are working towards those goals.
Effective event KPIs should help your team understand if you’re making the right decisions about your event. They are actionable, directly linked to event success, and guide you towards event outcomes.
Some examples of event KPIs include:
- NPS (Net Promoter Score)
- Return on Investment (ROI)
- Conversion rate of leads to customers
- CSat (Customer Satisfaction Score)
- CX Quotient
By focusing on event KPIs, event marketers can prioritize their efforts, decide which event success metrics to collect, and make data-driven decisions.
Benefits of tracking event metrics and event KPIs
Measuring the success of an event with event metrics and event KPIs is key if you want to show the value you create for your business through events.
Here are some other benefits that tracking event metrics can bring:
Elevate the customer experience
Use event metrics to clearly see when and how your attendees engaged with your event content. Then analyze these data to help you improve the customer experience for next time.
Improve future events
Effectively build better event engagement in the future to attract more attendees and keep them engaged during and after your events.
Reduce costs (and increase ROI)
By understanding where your attendees engage most during the omnichannel event journey, you know which touchpoints to invest in at future events.
Inform your next best action
By providing your marketing team and sales reps with detailed event metrics that contain first-party data about your attendees, they can decide which next best action to take.
Foster an efficient data-driven culture
Regularly measuring event success metrics instills a data-driven mindset. And this is simple if you have a fully integrated event tech stack that collects data for you.
How to measure event success with event metrics and event KPIs
Now you’ve understood the huge value that event metrics and event KPIs can bring to your business, you’ll want to know how to measure the success of an event.
Here are the steps to take:
#1 Get an integrated event platform and app that does most of the work for you
Tracking event metrics and event KPIs can be time-consuming if you don’t have an all-in-one event management platform and app that fits into your event tech stack. With a fully compliant and secure event platform and app like SpotMe that’s tailored for any event format in high-touch industries like life sciences and professional services, monitoring event metrics and event KPIs is easy.
With deep CRM and MAP integrations, including Veeva, you can connect your attendee data from your CRM to SpotMe. Then, you can focus on engaging your participants while your event platform and app collect all the data for you and automatically feed them back into your CRM, so you have a single source of truth.
SpotMe was named a Leader in The Forrester Wave™: B2B Event Management Technology, Q1 2023 report. Find out why by getting a complimentary copy.
#2 Define your event KPIs
Before deciding on which event metrics you want to track, you need to define your event KPIs. Your event KPIs will depend on which type of event you’re planning to run – virtual, hybrid, or in-person.
By defining your event KPIs in your event brief template, you get everyone on the same page about how you will measure the success of your event.
Some examples of event KPIs are:
- Increase the percentage of registered people who attend
- Number of people who attended / number of registrations
- Increase the use of your event app
- Compare the event metrics about event app sign-ins, engagement, time spent on the app and frequency of use to the metrics from your last event
- Boost engagement
- Compare the event metrics about live polling response rate, the number of chat messages exchanged, etc. to the metrics from your last event
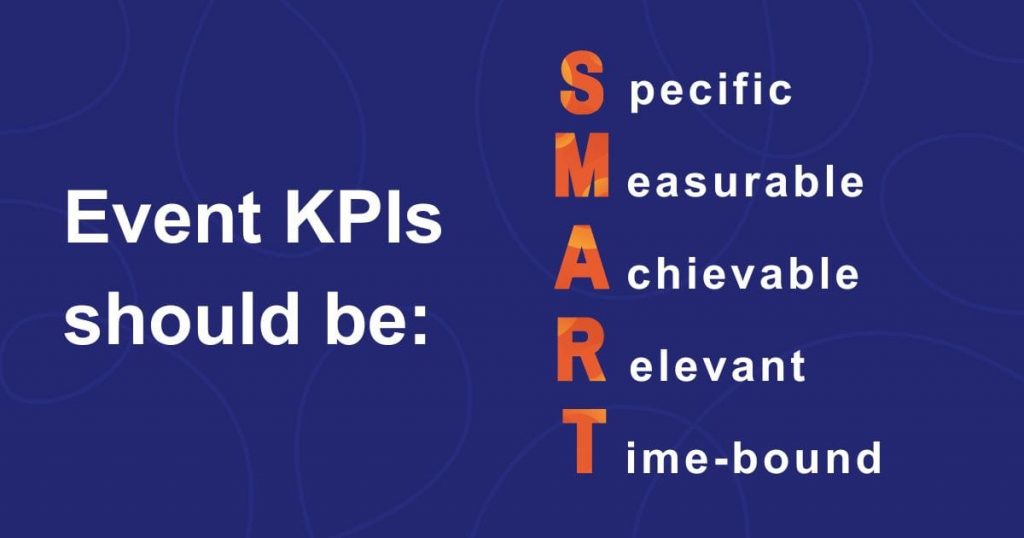
Remember to make your KPIs measurable. We recommend applying the SMART principle to help you clearly outline your event KPIs:
To help you find the event platform that collects event success metrics no matter what event format you’re creating, check out our lists of the best mobile event apps, hybrid event platforms, virtual event platforms, HCP event management platforms.
#3 Choose the event metrics you want to track
Once you have defined your event KPIs, you can decide which event success metrics will help you track them. Knowing what event KPIs you need to analyze will also help you determine which event technology you need to help you gather the event metrics you want.
#4 Let your event platform, app and CRM do the magic
Event platforms and apps like SpotMe automatically collect huge amounts of event metrics for you and feed the data into your CRM. That means you can simply look at all the event metrics after your event and choose the ones that are important to showing you have met your event KPIs and goals after your event.
If you’re a life science company and want to find out how you can use your pharma CRM to power your medical events, check out our article.
Event success metrics to track before your event
Event metric #1 Number of registrations
One of the most simple event success metrics to track is the number of people who sign up for your event i.e. attendance tracking. It’s a great way to understand how effective your landing page and marketing campaigns are.
Plus, you can use this event metric to track lead generation. Those who sign up for your event become leads for your business. Even if they don’t make it to your event, you can still nurture them down your marketing funnel.
Another way to use this event success metric is to understand how much interest people are showing in your topic. If the number of people who have registered is lower than expected, perhaps this isn’t a topic that appeals to your target audience. And so it may be a topic to avoid in the future. On the other hand, if the number of people who have registered is higher than expected, your topic could be one that you need to include more in your future content and event planning.
It’s always important to compare registration numbers to attendance numbers. More often than not, you’ll have a higher number of people registering than attending. But this event metric really shows how well you managed to intrigue your audience and persuade them to attend.
If you’re a life science company looking for other engagement metrics you should be tracking at your pharma events, check out HCP engagement: emerging trends, success metrics, and omnichannel strategies.
Event metric #2 Email open and click-through rate (CTR)
Email marketing is the most important tool for driving registrations for your event. But do you know how to measure event success with it? Simply track email open and click-through rates (CTR).
Email open rates show you when a recipient has opened their email. CTR tracks how many people clicked on a link within that email.
For instance, you sent 1,000 event registration emails, of which 400 were opened. Within those 400 emails opened, 200 people clicked on the event registration link. Of those 200 links clicked, 100 people actually registered for your event.
This event metric tells you that you have 900 people who will need another reminder email so they can click the registration link and register for your event.
Knowing which people opened your email and registered is a crucial event success metric to monitor so you can boost registration rates. Luckily, email open and CTR are standard features on most email marketing automation platforms.
Pro Tip: Don’t be shy when it comes to sending reminder emails. Sending 4 to 5 reminder emails might seem like a lot, but emails are easily buried and overlooked.
For inspiration on what to include in your event emails, download the best 18 free event email templates now.
Event metric #3 Accounts influenced (for B2B Marketers)
Depending on the type of event you’re hosting and the type of industry you’re in, your event KPI is most likely to attract either new customers, HCPs or higher-ups at companies (for new accounts) that you’d like to do business with.
That means that an event success metric to monitor is the source of your attendees. An easy way of determining this is by asking them on your registration page. Add questions such as “What company do you work for?” and “What’s your role in the company?”
If there’s a vendor, company, or person that attended your event that you want to work with in the future, take notice and use their attendance as a talking point for further engagement.
Pro Tip: You can also check email registration lists to see if attendees used their company’s email address to determine where they work.
Event metric #4 Social media engagement
Although you can’t track this through your event platform, social media is one of the most effective channels to reach people. But, it’s also a great source of event success metrics to understand how effective your event communication is. You can easily look at social media analytics from your company page.
Check how many people start following you once you advertise your event. This could indicate an increase in interest. And monitor how many people are liking, tagging, sharing, and reposting your posts about your upcoming event.
Although these event metrics are useful indicators, it’s also key to focus on what people are writing about your event in their comments. They will give you qualitative data you can use to make some changes to your upcoming event or improve future events.
You can even create an event hashtag before your event to increase its reach and engagement on social media. This way, you can track how many people are using the event hashtag too.

Event success metrics to track during your event
Event Metric #5 Event attendance
An event success metric that every event marketer should track is how many people attended the event. These data, when combined with other event metrics, like check-ins, follow-ups, sales, and others mentioned in this list, give you a clear picture of how successful your event was.
Event attendance tracking also helps you determine your event’s return on investment (ROI). For instance, calculate the expenses of your event and divide it by the number of people who attended to give you a rough estimate of how much you spent on each person.
Using event attendance as an event success metric also helps you gauge how effective your B2B event marketing strategy and communication efforts were in spreading the word to your audience.
Many virtual event apps feature built-in registration pages and check-in pages that automatically populate a spreadsheet filled with user data, so you have an accurate attendance count.
Event metric #6 Returning participants
If you see participants that you’ve seen before at your events, this can only be fantastic news! That means they like your content and the event experiences you give them. You’ve clearly given them something valuable in the past that they want to get more of.
This is an important event success metric to track if you are trying to increase your brand loyalty
Gather data and analyze this list of participants to understand your target audience better. And build your future events based on these event metrics.
These participants are already making their way through your marketing funnel. So, if you create events that continue to please them and keep them coming back for more, the likelihood of them converting gets higher and higher.
Seaching for event marketing strategies for your next virtual event? See 12 virtual event marketing strategies you need to succeed.
Event metric #7 Engagement rate
Attendees who are participating and interacting with each other are actively engaged, and it’s a clear indicator that your event is going great. So this is a key event success metric to track. Especially if one of your event KPIs is to boost engagement.
By tracking different forms of event engagement, you can narrow down specifically what your guests liked and didn’t like during your event, which will help you refine your events going forward and possibly your product or service.
Tracking engagement can involve many different sets of data and event metrics. For example, you can track speaker engagement by viewing how much “applause” or survey/poll responses each speaker got. Speakers who resonate most with your audience will garner the most praise, interactions, and attendance.
You can track user engagements to determine which attendees were the most active during your event. Tracking the number of posts and comments a user left on a live feed, the amount of time spent on the app, or the number of sessions viewed helps you understand what captured their attention, and what didn’t.
These event success metrics are useful for your salespeople who are contacting leads after the event. If they know a guest spent a lot of time participating, they’ll probably be more receptive to your sales offers.
Pro Tip: Take it one step further and analyze your live call to action (CTA) click-through rate. If it was high, take note of what you did right. If it was low, how could you improve setting up your CTA or offer included in it?
Want an event metrics template with a full list of event engagement metrics to help you easily define and track event KPIs? Download our event brief template now and use the relevant worksheet.
Event metric #8 Live polling response rate
Speakers should poll their audience frequently during a virtual event. Why? Because it’s easier for guests at home to get distracted and become unengaged. Maybe instead of watching the session, the attendee is watching Netflix or checking social media.
However, by polling the audience regularly, the speaker creates a back-and-forth conversation, gathering feedback that makes the guest feel important, and understood, and also steers the speaker in a positive direction that will create further engagement.
This event success metric helps event hosts and planners understand how interesting their speakers are, and how interested their guests are.
Pro Tip: Session speakers should poll their audience at least every 20 minutes to reduce attendee “drop off”.
Event metric #9 Number of chat messages
We’ve all watched live streams on YouTube with chat messages appearing every few seconds. We know it’s a sign of high engagement. So, make sure you monitor this event metric at your virtual events. It’s easy to see how many people are interacting within your chat.
Clearly, if participants are sending a lot of messages, that’s a positive thing. If people are talking about the event while it’s happening and seeing other people’s comments pop up, they will more likely stay engaged for a longer period of time.
This is another vital event success metric to measure if your event KPI is to increase engagement.
Pro tip: If participants bring up a subject that you don’t cover in your event, it could be great content to use in the future. Especially if more than one participant mentions it. So, make a note and keep it somewhere safe.

Event metric #10 Session popularity and analytics
You’ll want to know what your most popular and least popular sessions were so you can understand what topics and formats resonated the most with your audience, and which fell flat. These event success metrics help you continually improve your event’s messaging and scheduling, so you can repeat your successes and avoid irrelevant topics.
Common session KPIs include the number of people who watched the event, the time spent watching, and the number of page views.
As we mentioned before, another event success metric to track is which attendees watched each session. This helps you better understand each guest’s preferences and interests. Knowing what your attendees’ interests are will help you sell to them later.
Event metric #11 Event app adoption rate
Event apps have become indispensable tools for hosting virtual, hybrid, and traditional events. For virtual events, these apps become the actual venue itself, replacing the physical space.
Event apps allow your guests to attend and participate from anywhere with access to the internet and a computer, tablet, or smartphone, which improves your event attendance.
These apps also act as the central hub for your event. This allows a quick and easy way to notify guests of upcoming agenda changes, send reminders, add promotions, fill out surveys, and offer more engagement and messaging options.
For these reasons, a crucial event success metric to track is your event’s app adoption rate. This can include bonus event metrics such as sign-ins, engagements, time spent on the app, frequency of use, etc.
Event metric #12 Live webinar drop-off rate
The longer people watch your webinar, the more interested they are. If they watched the entire presentation, they’re probably very interested!
On average, most live webinars receive a 46% drop-off rate, meaning that slightly under half the people that tune in end up leaving before the webinar has finished.
Many virtual platforms’ analytics allow you to see how long visitors spent on your webinar and the precise moment when they dropped off.
With enough user data, you can pinpoint the specific topics and reasons why people began dropping off. Using these event success metrics, you can craft a new webinar that avoids the pitfalls of your previous one to lower drop-off rates and improve your conversion rates.
Event success metrics to track after your event
Event metric #13 Website traffic
You may see how effective your event was by analyzing your website traffic after your event. If you notice an increase in website visits, it may indicate people are searching for you after your event. Especially from people searching for your brand keywords and the non-branded keywords you used at your event.
It’s better to use UTMs to track website traffic that comes directly from your event. Of course, that prevents any assumptions and you’re able to see the immediate impact of your event.
To help boost this event success metric, make sure you have a detailed event page that includes your keywords and information about your topics, speakers, and more. Give the participants who choose to visit your website after the event the value they’re looking for.
Event metric #14 Net Promoter Score (NPS)
You’ve often seen this question on a survey, “How likely are you to recommend this event to your friends and colleagues on a scale of 1 to 10?”
Ideally, you’ll want to receive a 9 or 10. Anything less than that is an indicator that your attendee wasn’t sufficiently engaged during your event. A 7 or 8 rating is neutral and isn’t considered when calculating your Net Promoter Score. Any rating between 1-6 is negative.
To determine your Net Promoter Score, take the percentage of positive responses (9s and 10s) and subtract the percentage of negative responses (1-6s). Again, ignore the percentage of neutral ratings (the 7s and 8s).
This is a simple event success metric to track numerically. Although, we also recommend asking your participants for written answers to understand why they would or wouldn’t recommend your event. This qualitative event metric gives you more information to help you improve future events.
Pro Tip: With event platforms, gathering this event metric can easily be done in the form of a survey.
Event metric #15 Attendee to sales qualified lead (SQL) conversion
How many of your attendees are actually interested in purchasing your products and services? How many aren’t? Knowing what makes a lead qualified or not is necessary to improve revenue and attract the right attendees to your event.
Simply put, sales-qualified leads (SQL) are people who attended your event and are “sales-ready.”
These people checked all the right boxes of desired traits and actions that seem to be a good fit for your sales team to reach out to – they attended the event, participated, watched several sessions, and filled out many surveys. Odds are, they want what you’re selling.
However, if your attendees don’t participate, don’t watch sessions, and only log in once, they aren’t highly qualified, and probably won’t be interested in further engagement from your company.
Tracking user engagement rates will help you determine your lead quality for higher attendee-to-SQL conversion. Therefore, this is another important event success metric to measure.
Check out Sales and Marketing Alignment: How To Bring Them Together In Your Virtual Event Strategy to ensure both teams are on the same page for all of your events.

Event metric #16 Cost per attendee/customer acquisition
You can’t calculate your event’s ROI without understanding your cost per attendee or cost per customer acquisition.
Simply put, how much money did you spend on planning, marketing, and running the event, versus the amount you got back from new sales or new impressions/attendees?
Tracking this event success metric is simple: calculate the amount spent on the event and divide that by the number of people who attended.
However, when it comes to tracking customers, it gets a bit trickier. Did your guest turn into a customer during the event, immediately after, or did they become a customer months after attending? Tracking event attendance can help answer these questions to give you a more accurate ratio.
Pro Tip: Always ask for a referral source when making your sale with a new customer. Perhaps they attended your event last year or heard about your event from a colleague who attended. You can use this information to update your cost-per-customer acquisition ratio.
If you’d like to reduce your event costs, discover 11 tips to help you optimize your virtual event budget.
Event metric #17 Post-event surveys
Post-event surveys help you track your event and brand’s sentiment – how attendees actually feel about your event and your company. Sentiment should not be overlooked, even if it isn’t an event success metric that neatly converts into a monetary value.
Post-event surveys are a good opportunity to determine your Net Promoter Score and gather feedback that will help improve your event and its marketing efforts moving forward.
Event metric #18 On-demand content engagement
Turning your live event content into on-demand content is a simple way to let those who couldn’t attend engage with your event. This will boost your brand’s reputation as one that is mindful of people’s time.
If the number of on-demand viewers is high, this is an event success metric that proves your event was a success. Especially if the number of applause people give while watching the event increases.
You may also add downloadable content from your event to your gated on-demand content hub. And here, you can monitor the number of downloads people carry out to understand the content’s value for consumers.
Event metric #19 Revenue made
You’ll have started out planning your event with a budget and with a financial objective. In the end, a lot of events are about engaging audiences as much as possible. But, they are also about making a profit in some way. So, this is an event success metric that is crucial to calculate.
To assess how much revenue you managed to make, you could add up the number of tickets you sold and the money you got from sponsorships.
Make measuring event metrics a breeze with a CRM-integrated event platform and app
If you’re looking for an all-in-one event management platform and in-person app that are fully compliant and integrates with your CRM and the rest of your event stack to create a seamless omnichannel experience, SpotMe could be the one.
Named a Leader in The Forrester Wave™: B2B Event Management Technology, Q1 2023 report, “SpotMe offers a unique approach to CRM integrations”. Its wide range of engagement features makes it the ideal choice for high-touch industries. For example, life sciences and professional services that want to improve attendee experience while collecting important event metrics to drive their next best action.
Its built-in analytics tool gives you all the event metrics your team needs to measure event success. And its analytics dashboard provides quick access to important high-level analytics for event KPIs such as event attendance, user engagement, polling responses, session popularity, drop-off rates, and more!
To find out more about how SpotMe can help you collect event metrics in your CRM and show leadership the value that events bring to your business, request a demo today.